- Published on
- 32 min read
Measuring CRISPR editing efficiency from start to finish: a complete protocol overview
- Authors

- Name
- BioTech Bench
Table of contents
- What you'll learn
- Step 1: Match the readout to your editing modality and stage
- Step 2: Wet-lab protocol from cell harvest to clean PCR amplicon
- Step 3: Why T7E1, Sanger ICE, and Amplicon NGS disagree (worked in R)
- Step 4: Screening single-cell clones without missing homozygotes or hemizygotes
- Step 5: Closing the loop — off-targets and functional protein validation
- Honest caveats: 6 validation mistakes that derail CRISPR projects
- How I validate CRISPR experiments in practice
- Resources
If you run a T7 endonuclease I (T7E1) assay, a Sanger trace decomposition in ICE, and targeted amplicon next-generation sequencing (Amplicon NGS) on the exact same tube of genomic DNA from a well-edited cell pool, you will get three different numbers. When true editing at the locus is 60%, your T7E1 gel will report roughly 37%, your ICE chromatogram fit will report 58%, and your amplicon NGS run will report 60.2%. Push that editing rate up to a 100% homozygous -1 bp / -1 bp single-cell knockout clone, and an unspiked T7E1 gel will tell you the editing efficiency is 0%.
Every month I talk to someone who threw away a working guide RNA or discarded a clean homozygous knockout clone because they used the wrong validation readout for their stage of the experiment — or harvested genomic DNA before their editor had finished cutting.
Over the last five posts of this series, we examined each validation tool in isolation: comparing the three main on-target readouts, running T7E1 and Surveyor mismatch-cleavage gels, deconvolving Sanger .ab1 traces with TIDE and ICE, designing a two-step barcoded amplicon NGS strategy, and mapping genome-wide cleavage with GUIDE-seq, CIRCLE-seq, Digenome-seq, and DISCOVER-seq. This Arc 2 capstone pulls all of those pieces into a single, start-to-finish protocol — from harvesting cells and extracting genomic DNA to running a side-by-side quantitative benchmark on human EMX1 exon 3 and genotyping single-cell clones without falling into allele-dropout traps.
What you'll learn
- How to match your validation assay to your editing modality — why bulk knockouts, single-cell clones, cytosine/adenine base edits, prime edits, and ssODN/plasmid HDR knock-ins each require a different combination of screening and confirmation assays
- When to harvest genomic DNA (
48 hvs.72–96 hvs.Day 7+) depending on whether you delivered RNP, mRNA, plasmid, or lentivirus — and why harvesting an HDR experiment too early turns leftover donor DNA into fake knock-in reads - How to run the wet-lab workflow from cell pellet to PCR amplicon, including when a $0.15
QuickExtractcrude lysate beats a silica spin column and whyTaqpolymerase ruins T7E1, Sanger decomposition, and NGS - Why T7E1, Sanger ICE, and Amplicon NGS disagree on the exact same DNA sample, worked in R with real EMX1 indel spectra and a 9-point titration series from
0%to100%editing - How to screen 96-well plates of single-cell clones, including the
1:1wild-type amplicon spike-in that rescues T7E1 on homozygous clones and the long-range PCR check that catches hemizygous large deletions - Why DNA frameshift percentage does not equal protein loss, and how to close the loop from on-target and off-target NGS (
CRISPResso2andCRISPECTOR) to Western blot and RT-qPCR verification
Step 1: Match the readout to your editing modality and stage
The biggest mistake in CRISPR validation is treating T7E1, Sanger sequencing, droplet digital PCR (ddPCR), and amplicon NGS as interchangeable ways to measure "percent editing." Each assay detects a different physical property of your DNA:
- T7E1 and Surveyor detect DNA heteroduplex kinks formed when two different alleles denature and re-anneal together. They cannot tell a
+1 bpframeshift insertion from a-3 bpin-frame deletion, they miss single-base substitutions almost completely, and they cannot cut homoduplexes where both strands carry the exact same mutation. - Sanger trace decomposition (
TIDE,ICE,DECODR) detects chromatogram phase shifts where an insertion or deletion slides every downstream Sanger peak left or right relative to a wild-type trace. And for base editing (where there is no phase shift), EditR (Kluesner et al., The CRISPR Journal 2018) and MultiEditR measure the relative fluorescence area under overlappingA/GorC/Ttrace peaks at your target nucleotide. - RFLP (restriction fragment length polymorphism) and ddPCR detect the presence or loss of a specific sequence motif at the cut site (such as an engineered EcoRI
GAATTCsite in an ssODN knock-in, or a hydrolysis probe that drops off when an indel disrupts its binding footprint). - Targeted Amplicon NGS (
CRISPResso2) sequences individual DNA molecules one by one, giving you exact read counts for wild-type alleles, frameshift vs. in-frame indels, clean vs. bystander-mutated base edits, and clean vs. imperfect HDR knock-ins (as we saw in Post 17 on runningCRISPResso2).
Here is the decision matrix I use to pick the right assay at each stage of a project:
| Editing modality & stage | Fast bench screen (Day 1–2) | Routine quantitative readout (Day 2–3) | Publication / clonal confirmation | Assay to avoid (and why) |
|---|---|---|---|---|
| SpCas9 / Cas12a bulk knockout (guide ranking) | T7E1 gel (optional if Sanger is fast) | Sanger .ab1 + ICE or DECODR | Amplicon NGS (CRISPResso2 -c) + Western blot | Uncalibrated T7E1 alone — plateaus above ~50% editing and hides in-frame -3 bp indels |
| Single-cell knockout clones (96-well plate) | T7E1 with 1:1 WT PCR spike-in | Sanger .ab1 + ICE / DECODR on top hits | Amplicon NGS + long-range PCR + Western blot | Unspiked T7E1 — homozygous -1/-1 clones form 100% homoduplexes and score 0% |
Base editing (CBE / ABE point conversion) | Sanger .ab1 + EditR / MultiEditR | Sanger + EditR (LOD ~5%–7%) | Amplicon NGS (CRISPResso2 --base_editor_output -w 10) | T7E1 or standard TIDE — base editors don't make indels, and T7E1 barely cleaves 1-nt bubbles |
Prime editing (PE2 / PE3 / PEmax) | Sanger .ab1 + ICE (knock-in mode) or RFLP | Amplicon NGS or probe ddPCR | Amplicon NGS (CRISPResso2 prime-editing mode) | T7E1 — misses clean prime edits and only cuts undesired flap-indel byproducts |
HDR knock-in (ssODN or plasmid donor <50 bp) | RFLP digest (if silent site added) | Sanger + ICE (HDR mode) or drop-off ddPCR | Amplicon NGS (CRISPResso2 -e) with out-of-arm primers | Primers inside homology arms — amplifies episomal donor DNA and inflates apparent HDR |
Large knock-in (GFP tag / cassette >200 bp) | In-out junction PCR (5' and 3' junctions) | Copy-number ddPCR + flow cytometry (if fluorescent) | Long-read sequencing (Nanopore/PacBio) + Southern | Short-amplicon Illumina NGS alone — 250-bp reads cannot span a 750-bp GFP cassette + arms |
| Off-target validation (therapeutic / lead guides) | In silico nomination (CRISPOR / CFD) | GUIDE-seq (cells) or CIRCLE-seq (in vitro) | Multiplexed Amplicon NGS + CRISPECTOR (paired mock) | Sanger/TIDE on off-targets — cannot detect off-target indels below 2%–5% |
Step 2: Wet-lab protocol from cell harvest to clean PCR amplicon
Even the best bioinformatics pipeline cannot rescue a sample that was harvested at the wrong time, contaminated with leftover donor plasmid, or amplified with the wrong polymerase. Here is the step-by-step bench protocol that feeds T7E1, Sanger, and Amplicon NGS from a single genomic DNA harvest.
1. When to harvest genomic DNA (delivery kinetics matter)
When Cas9 cuts chromosomal DNA, the cell repairs the break and Cas9 immediately binds and re-cuts as long as the protospacer and PAM remain intact. Indels accumulate over time until either the target sequence is mutated beyond recognition or the Cas9 complex is degraded (Brinkman et al., Molecular Cell 2018; Rose et al., Nature Methods 2017).
- Cas9 RNP or mRNA + synthetic sgRNA (electroporation / lipofection): Cleavage starts within 2–4 hours, and indel accumulation plateaus between 36 and 48 hours. Harvesting at 48–72 hours gives you the true initial editing rate before cell-cycle selection skews the population.
- Plasmid DNA transfection (e.g.,
PX458/PX459): The plasmid must reach the nucleus, transcribe Cas9 mRNA and sgRNA, and translate the protein. Harvesting at 24 hours routinely underestimates final editing by 40%–60%. Wait 72 hours (or 72–96 hours if selecting with puromycin on days 1–3). - Lentiviral transduction: Wait 5 to 7 days post-transduction. Lentiviral integration and steady-state expression are slower, and constitutive Cas9 expression continues accumulating indels through day 7.
- HDR knock-in (ssODN or dsDNA donor): Wait at least 72 hours and passage the cells once before harvesting gDNA. At 24–48 hours, transfected cells are still coated with millions of copies of unintegrated single-stranded oligodeoxynucleotide (ssODN) or plasmid donor. During PCR, those free donor molecules act as megaprimers that anneal to wild-type genomic strands ("template switching" or PCR jumping), creating chimeric PCR products that look identical to genuine chromosomal HDR.
- Essential-gene check (Day 3 vs. Day 10): If you are knocking out a gene required for proliferation, harvest an aliquot at Day 3 (to measure initial cutting) and a second aliquot at Day 10–14. If
CRISPResso2shows 65% frameshift indels at Day 3 but only 8% frameshift indels (and 45%-3 bpin-frame deletions) at Day 12, your guide cut fine — the knockout cells simply died out and were outgrown by wild-type and in-frame-edited survivors!
2. Genomic DNA extraction: QuickExtract vs. silica spin columns
You do not need a $4 spin column for every well of a 96-well guide screen, but you do need to know when crude lysis breaks downstream assays:
- For 24- to 96-well guide screens, clone picking, T7E1, Sanger/ICE, and standard 2-step Amplicon NGS: Use a proteinase-K lysis buffer such as Lucigen QuickExtract (or homemade direct-PCR lysis buffer:
10 mM Tris-HCl pH 8.0,2 mM EDTA,0.2% Triton X-100,200 µg/mL Proteinase K). Pelleted cells from one well of a 96-well plate (~20,000–50,000 cells) resuspended in30–50 µLlysis buffer, incubated at 65 °C for 15 min followed by 98 °C for 2 min to heat-inactivate Proteinase K, can go straight into aQ5PCR reaction at1–2 µLper25 µLreaction (keep crude lysate of final PCR volume so cellular debris doesn't inhibit the polymerase). - For ddPCR, long-range PCR (>1.5 kb), GUIDE-seq, CIRCLE-seq, or Nanopore sequencing: Use a silica spin column (e.g., Monarch or DNeasy Blood & Tissue) or AMPure XP / SPRI magnetic beads with an RNase A digestion step, and elute in low-EDTA
10 mM Tris-HCl pH 8.0. Measure concentration by Qubit dsDNA BR (not NanoDrop alone, since RNA and free dNTPs in crude lysates inflate by 3- to 5-fold).
3. Nested / dual-purpose primer layout on EMX1 exon 3
Notice a fundamental tension between our three on-target assays:
- T7E1 and Sanger (
TIDE/ICE) need a 450–700 bp amplicon with the Cas9 cut site placed asymmetrically (e.g.,~330 bpfrom the forward primer and~250 bpfrom the reverse primer). Why asymmetric? Because on a T7E1 agarose gel, if your cut site is dead-center in a 500-bp amplicon, both cleavage fragments are250 bpand comigrate as a single band (250 + 250), cutting your apparent band signal in half and hiding whether cleavage occurred cleanly! And for Sanger sequencing, the capillary needs100–150 bpof clean upstream baseline before the cut site, plus200–300 bpof downstream trace after the cut site for linear regression decomposition. - Illumina Amplicon NGS (
2×150 bppaired-end) needs a 150–250 bp amplicon with primers at least 50 bp away from the cut site so Read 1 and Read 2 overlap across the entire edited window (Post 13).
In my own projects, I design two primer pairs per target locus before ordering oligos:
- Outer pair (
580 bpat EMX1): Used for T7E1 (cleaves into distinct332 bp+248 bpbands on a 2% agarose gel) and Sanger sequencing (ICE/EditR). - Inner pair with Illumina overhangs (
180 bpgenomic target at EMX1): Used for two-step Amplicon NGS (CRISPResso2, Post 17), where the cut site sits at base90/91(90 bpfrom the forward end and90 bpfrom the reverse end).
4. Why proofreading polymerase (Q5 or PrimeSTAR GXL) is mandatory
Never use standard Taq polymerase for CRISPR validation. Here is why Taq sabotages all three assays:
- 3' dA overhangs and polymerase slippage:
Taqadds untemplated 3' adenines and slips frequently on homopolymer runs (AAAAA), creating shadow peaks in Sanger chromatograms that dropTIDE/ICEbelow0.80and create artificial heteroduplexes in T7E1. - High substitution error rate (
~1–2 × 10⁻⁴per base per cycle): After 30 cycles of PCR on a 200-bp amplicon,Taqintroduces background substitutions in0.5%–1.5%of reads inside your quantification window, drowning out true low-frequency base edits or off-target indels. - Always use a high-fidelity proofreading enzyme such as NEB Q5 High-Fidelity 2X Master Mix or Takara PrimeSTAR GXL, limit PCR1 to 28–30 cycles on
50–100 ngof gDNA (~15,000–30,000human diploid genome equivalents) to prevent PCR jackpot bias, and always amplify a matched mock-transfected parental cell control alongside your edited samples.
Step 3: Why T7E1, Sanger ICE, and Amplicon NGS disagree (worked in R)
To see why these three assays report different numbers on the exact same DNA — and when you can trust each one — let's analyze a real 9-sample benchmark dataset at our EMX1 exon 3 locus in R.
Recall from Post 17 (CRISPResso2 tutorial) that when SpCas9 cuts EMX1 exon 3 (GAGTCCGAGCAGAAGAAGAA + GGG), cellular NHEJ and MMEJ repair do not produce a random smear of 50 different indels. Instead, local sequence microhomology produces six dominant mutant alleles (985 reads with -1 bp, 640 with +1 bp, 415 with -2 bp, 310 with an in-frame -3 bp deletion, 225 with -4 bp, and 125 with -8 bp, out of 2,700 NHEJ reads).
Why does that allele distribution matter for T7E1? Because during the T7E1 re-annealing step (95 °C denaturation followed by slow ramping at -2 °C/s to 85 °C and -0.1 °C/s to 25 °C), DNA strands pair up at random. If a -1 bp mutant sense strand pairs with a wild-type antisense strand, or with a +1 bp mutant antisense strand, they form a heteroduplex bubble that T7E1 can cleave. What if a -1 bp mutant sense strand pairs with another -1 bp mutant antisense strand? They form a perfectly matched mutant homoduplex with zero mismatch bubble — and T7E1 leaves it completely uncut!
If the relative frequencies of our distinct mutant alleles among all edited alleles are (where ), then whenever two mutant strands meet during re-annealing, the probability that they carry the exact same indel and form an uncuttable mutant homoduplex is:
Let's load our EMX1 indel spectrum in R and calculate both (the mutant homoduplex fraction) and the exact frameshift percentage:
library(tibble)
library(dplyr)
library(tidyr)
library(ggplot2)
options(width = 120, pillar.width = 120)

# EMX1 indel spectrum from our CRISPResso2 run (total NHEJ = 2,700 reads)
emx1_indels <- tibble(
  allele = c("-1 bp del", "+1 bp ins", "-2 bp del", "-3 bp del (in-frame)", "-4 bp del", "-8 bp del"),
  reads = c(985, 640, 415, 310, 225, 125),
  frameshift = c(TRUE, TRUE, TRUE, FALSE, TRUE, TRUE)
) |>
  mutate(
    rel_freq = round(reads / sum(reads), 4),
    homoduplex_prob = round((reads / sum(reads))^2, 4)
  )

print(emx1_indels)
cat("Mutant-mutant homoduplex fraction (sum of p_i^2):", sum(emx1_indels$homoduplex_prob), "\n")
cat("Frameshift fraction of NHEJ reads:", sum(emx1_indels$rel_freq[emx1_indels$frameshift]), "\n")
# A tibble: 6 × 5
  allele               reads frameshift rel_freq homoduplex_prob
  <chr>                <dbl> <lgl>         <dbl>           <dbl>
1 -1 bp del              985 TRUE         0.365           0.133
2 +1 bp ins              640 TRUE         0.237           0.0562
3 -2 bp del              415 TRUE         0.154           0.0236
4 -3 bp del (in-frame)   310 FALSE        0.115           0.0132
5 -4 bp del              225 TRUE         0.0833          0.0069
6 -8 bp del              125 TRUE         0.0463          0.0021
Mutant-mutant homoduplex fraction (sum of p_i^2): 0.2351
Frameshift fraction of NHEJ reads: 0.8851
Look at those two numbers:
Mutant-mutant homoduplex fraction = 0.2351(23.51%): Simply because-1 bp(36.5%) and+1 bp(23.7%) dominate the repair outcomes at EMX1, nearly one in four mutant–mutant duplexes re-anneals into an identical homoduplex (-1/-1or+1/+1) that T7E1 cannot recognize as a mismatch. Worse, T7E1 only cleaves about 80%–85% of true heteroduplexes (it is notoriously inefficient on single-base bulges, as demonstrated by Vouillot et al., BMC Genomics 2015 and Sentmanat et al., Scientific Reports 2018).Frameshift fraction = 0.8851(88.51%): Even among cells that do have an indel,11.5%carry the-3 bpin-frame deletion that deletes a single amino acid without disrupting the downstream reading frame.
Comparing T7E1, Sanger ICE, and Amplicon NGS across a 0%–100% titration series
Now let's take our 580-bp outer EMX1 amplicon (which T7E1 cuts into a 332-bp fragment and a 248-bp fragment) across a 9-sample titration series (S1_Mock at 0% through S8_Poly100 at 100% polyclonal editing, plus S9_Clone_Homo, a single-cell clone that is 100% homozygous for the -1 bp deletion).
In R, we calculate the cleaved band fraction from gel densitometry, apply the standard Guschin et al. (2010) heteroduplex equation:
and compare it directly against Sanger + ICE (ice_score_pct and model fit ice_r_squared) and Amplicon NGS (ngs_modified_pct from CRISPResso2):
titration <- tibble(
  sample_id = c("S1_Mock", "S2_Low2", "S3_Low5", "S4_Med15",
                "S5_Med35", "S6_High60", "S7_High85", "S8_Poly100", "S9_Clone_Homo"),
  true_edit_pct    = c(  0.0,   2.0,   5.0,  15.0,  35.0,  60.0,  85.0, 100.0, 100.0),
  uncut_580bp_ng   = c(198.0, 195.6, 185.2, 152.0, 109.8,  79.4,  71.6,  89.2, 197.4),
  cut_332bp_ng     = c(  1.1,   2.5,   8.5,  27.6,  51.8,  69.3,  73.8,  63.7,   1.5),
  cut_248bp_ng     = c(  0.9,   1.9,   6.3,  20.4,  38.4,  51.3,  54.6,  47.1,   1.1),
  ice_score_pct    = c(  0.0,   0.0,   4.0,  14.0,  33.0,  58.0,  81.0,  94.0,  99.0),
  ice_r_squared    = c( 0.99,  0.98,  0.96,  0.97,  0.96,  0.95,  0.88,  0.79,  0.99),
  ngs_modified_pct = c( 0.12,  2.08,  5.04, 15.12, 34.88, 60.16, 84.92, 99.84, 99.92)
) |>
  mutate(
    f_cut = round((cut_332bp_ng + cut_248bp_ng) / (uncut_580bp_ng + cut_332bp_ng + cut_248bp_ng), 3),
    t7e1_indel_pct = round(100 * (1 - sqrt(1 - f_cut)), 1)
  )

print(
  titration |>
    select(sample_id, true_edit_pct, f_cut, t7e1_indel_pct, ice_score_pct, ice_r_squared, ngs_modified_pct)
)
# A tibble: 9 × 7
  sample_id     true_edit_pct f_cut t7e1_indel_pct ice_score_pct ice_r_squared ngs_modified_pct
  <chr>                 <dbl> <dbl>          <dbl>         <dbl>         <dbl>            <dbl>
1 S1_Mock                   0 0.01             0.5             0          0.99             0.12
2 S2_Low2                   2 0.022            1.1             0          0.98             2.08
3 S3_Low5                   5 0.074            3.8             4          0.96             5.04
4 S4_Med15                 15 0.24            12.8            14          0.97            15.1
5 S5_Med35                 35 0.451           25.9            33          0.96            34.9
6 S6_High60                60 0.603           37              58          0.95            60.2
7 S7_High85                85 0.642           40.2            81          0.88            84.9
8 S8_Poly100              100 0.554           33.2            94          0.79            99.8
9 S9_Clone_Homo           100 0.013            0.7            99          0.99            99.9
Let's plot those curves side-by-side in ggplot2 so you can see the exact dynamic range where each method works and where it breaks down:
curve_df <- tibble(true_edit_pct = seq(0, 100, by = 1)) |>
  mutate(
    E = true_edit_pct / 100,
    f_cut_poly = 0.82 * (2 * E * (1 - E) + (E^2) * (1 - 0.2352)) + 0.01 * (1 - E),
    T7E1_Polyclonal = 100 * (1 - sqrt(1 - f_cut_poly)),
    f_cut_mono = 0.82 * (2 * E * (1 - E)) + 0.01,
    T7E1_Single_Indel = 100 * (1 - sqrt(1 - f_cut_mono))
  )

pts_long <- titration |>
  filter(sample_id != "S9_Clone_Homo") |>
  select(true_edit_pct,
         `Amplicon NGS (CRISPResso2)` = ngs_modified_pct,
         `Sanger + ICE` = ice_score_pct,
         `T7E1 (Polyclonal pool)` = t7e1_indel_pct) |>
  pivot_longer(-true_edit_pct, names_to = "Method", values_to = "measured_pct")

p1 <- ggplot() +
  annotate("rect", xmin = 0, xmax = 5, ymin = 0, ymax = 105, fill = "#fee2e2", alpha = 0.45) +
  annotate("rect", xmin = 75, xmax = 100, ymin = 0, ymax = 105, fill = "#fef3c7", alpha = 0.45) +
  geom_abline(slope = 1, intercept = 0, linetype = "dashed", color = "#64748b", linewidth = 0.7) +
  geom_line(data = curve_df, aes(x = true_edit_pct, y = T7E1_Single_Indel),
            color = "#dc2626", linetype = "dotted", linewidth = 0.9) +
  geom_line(data = pts_long, aes(x = true_edit_pct, y = measured_pct, color = Method), linewidth = 1.1) +
  geom_point(data = pts_long, aes(x = true_edit_pct, y = measured_pct, color = Method, shape = Method), size = 3.2) +
  geom_point(data = filter(titration, sample_id == "S9_Clone_Homo"),
             aes(x = true_edit_pct, y = t7e1_indel_pct), color = "#dc2626", shape = 17, size = 3.8) +
  annotate("text", x = 3.2, y = 96, label = "T7E1/Sanger\nLOD (<5%)",
           size = 3.1, color = "#991b1b", fontface = "bold", hjust = 0) +
  annotate("text", x = 76.5, y = 96, label = "Homoduplex\nsaturation (>75%)",
           size = 3.1, color = "#92400e", fontface = "bold", hjust = 0) +
  annotate("label", x = 98, y = 16,
           label = "Homozygous -1/-1 clone\non unspiked T7E1 (0.7%)",
           size = 3.0, fill = "#fef2f2", color = "#dc2626", fontface = "bold", hjust = 1) +
  scale_color_manual(values = c(
    "Amplicon NGS (CRISPResso2)" = "#0284c7",
    "Sanger + ICE" = "#7c3aed",
    "T7E1 (Polyclonal pool)" = "#d97706"
  )) +
  scale_x_continuous(breaks = seq(0, 100, 20), limits = c(0, 102)) +
  scale_y_continuous(breaks = seq(0, 100, 20), limits = c(0, 105)) +
  labs(
    title = "Measured vs. true CRISPR editing efficiency across the EMX1 titration series",
    subtitle = "Amplicon NGS stays linear (0.1%–100%); ICE tracks closely (5%–85%); T7E1 saturates and misses homozygous clones",
    x = "True editing efficiency in sample (% mutant DNA)",
    y = "Measured editing efficiency (%)",
    color = "Assay readout",
    shape = "Assay readout"
  ) +
  theme_minimal(base_size = 12) +
  theme(
    plot.title = element_text(face = "bold", size = 13.5),
    plot.subtitle = element_text(color = "#475569", size = 10.5),
    legend.position = "bottom",
    panel.grid.minor = element_blank(),
    plot.background = element_rect(fill = "white", color = NA)
  )

ggsave("fig-crispr15-method-comparison.png", p1, width = 9.5, height = 5.8, dpi = 300)
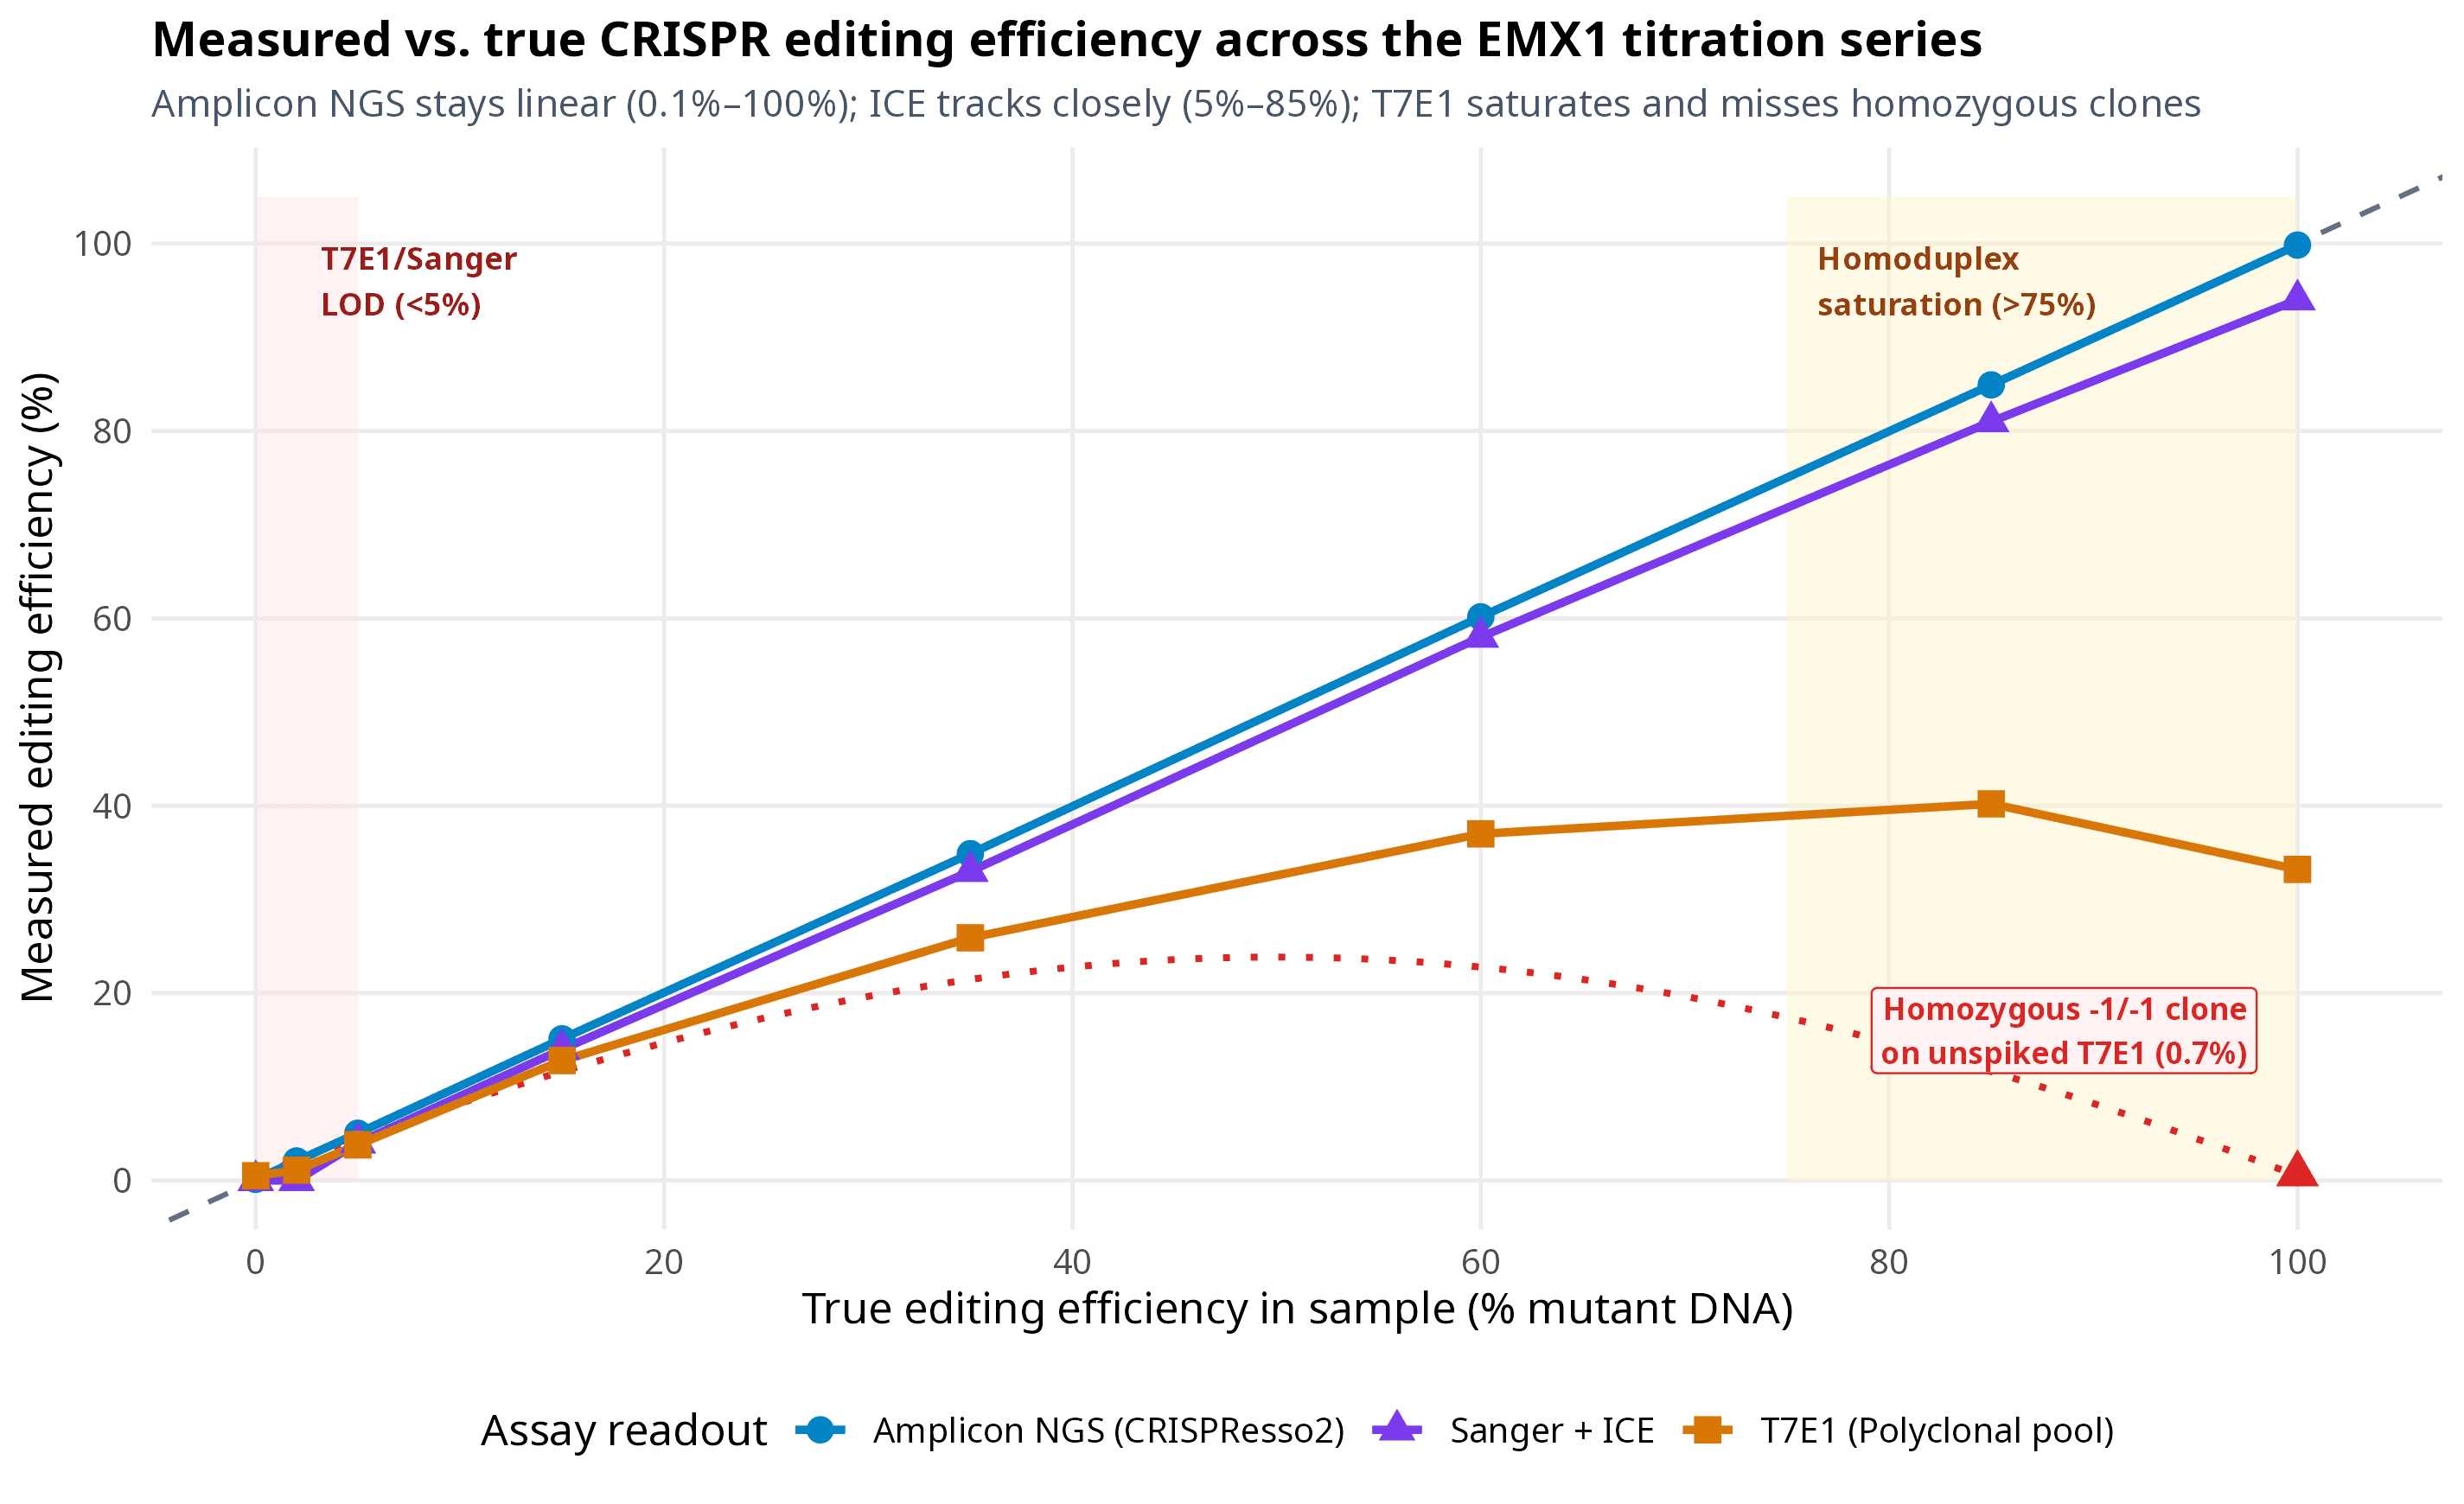
Figure 1. Measured vs. true CRISPR editing efficiency across our 9-sample _EMX1 titration series (S1_Mock to S9_Clone_Homo). Targeted Amplicon NGS (CRISPResso2, blue circles) tracks the identity line from 0.12% background up to 99.92%. Sanger trace decomposition (ICE, purple triangles) tracks within 2–4 percentage points between 5% and 85%, with dropping from 0.95 to 0.79 in the 100% polyclonal pool as wild-type reference peaks vanish. Polyclonal T7E1 (orange squares) plateaus at 40.2% at 85% true editing and drops back to 33.2% at 100% editing because 23.5% of re-annealed duplexes are identical mutant homoduplexes; for a single-allele -1/-1 homozygous clone (S9_Clone_Homo, red triangle and dotted curve), unspiked T7E1 reads 0.7%. Output of the code above._
Look at the three regimes highlighted in Figure 1:
- Below
5%(S2_Low2at2.0%true editing): Both T7E1 (1.1%, indistinguishable from mock gel background) and SangerICE(0.0%) miss the edit completely. If you are measuring low-efficiency HDR, in vivo lipid nanoparticle delivery in a minor cell subpopulation, or off-target cleavage, only Amplicon NGS (2.08%, limit of detection~0.1%—or~0.01%with error-corrected methods) or ddPCR (LOD ~0.05%–0.1%) has the sensitivity to see it. - Between
10%and75%(S4_Med15throughS6_High60): This is the sweet spot where Sanger +ICE(14%,33%,58%with ) gives you nearly the same answer as Amplicon NGS (15.1%,34.9%,60.2%) for$4–$8a tube in 24 hours. Meanwhile, T7E1 is already compressing a60%edit down to37.0%. - Above
75%(S7_High85,S8_Poly100, andS9_Clone_Homo): As wild-type alleles disappear, T7E1 actually bends downward (40.2%at85%editing →33.2%at100%polyclonal editing →0.7%on the homozygous-1/-1clone!). And inS8_Poly100,ICEstill reports94%, but notice its drops to0.79because six overlapping mutant traces with zero remaining wild-type component exceed the linear regression window. By contrast,S9_Clone_Homohas a single pure-1 bptrace, soICEfits it cleanly (99%, ).
Step 4: Screening single-cell clones without missing homozygotes or hemizygotes
Suppose your bulk EMX1 knockout pool hit 60.2% indels, and you sorted single cells into a 96-well plate to isolate a clonal knockout cell line. Two weeks later, you have 48 surviving colonies. How do you genotype them?
Let's look at five real diploid genotypes you will encounter in that 96-well plate (Clone_A through Clone_E), and see how four different genotyping assays score each one:
clone_screen <- tibble(
  clone_id = c("Clone_A", "Clone_B", "Clone_C", "Clone_D", "Clone_E"),
  true_genotype = c("WT / WT", "WT / -1 bp", "-1 bp / +1 bp", "-1 bp / -1 bp", "-1 bp / -450 bp del"),
  t7e1_unspiked_pct = c(0.5, 29.3, 28.6, 0.7, 0.6),
  t7e1_wt_spiked_pct = c(0.5, 19.4, 29.0, 29.3, 29.1),
  sanger_ice_call = c("0% (WT)", "49% (-1)", "98% (-1/+1)", "99% (-1)", "99% (-1)*"),
  short_ngs_call = c("0.1% mod", "50.2% (-1)", "99.9% (-1/+1)", "99.9% (-1)", "99.8% (-1)*"),
  long_pcr_bands_bp = c("1200", "1200", "1200", "1200", "1200 + 750")
)

print(clone_screen)
# A tibble: 5 × 7
  clone_id true_genotype       t7e1_unspiked_pct t7e1_wt_spiked_pct sanger_ice_call short_ngs_call long_pcr_bands_bp
  <chr>    <chr>                           <dbl>              <dbl> <chr>           <chr>          <chr>
1 Clone_A  WT / WT                           0.5                0.5 0% (WT)         0.1% mod       1200
2 Clone_B  WT / -1 bp                       29.3               19.4 49% (-1)        50.2% (-1)     1200
3 Clone_C  -1 bp / +1 bp                    28.6               29   98% (-1/+1)     99.9% (-1/+1)  1200
4 Clone_D  -1 bp / -1 bp                     0.7               29.3 99% (-1)        99.9% (-1)     1200
5 Clone_E  -1 bp / -450 bp del               0.6               29.1 99% (-1)*       99.8% (-1)*    1200 + 750
Let's visualize the apparent editing signal across all five clones:
clone_plot_df <- tibble(
  clone = factor(
    rep(c("Clone A\n(WT / WT)",
          "Clone B\n(WT / -1 bp)",
          "Clone C\n(-1 bp / +1 bp)",
          "Clone D\n(-1 bp / -1 bp)",
          "Clone E\n(-1 bp / -450 bp del)"), each = 4),
    levels = c("Clone A\n(WT / WT)",
               "Clone B\n(WT / -1 bp)",
               "Clone C\n(-1 bp / +1 bp)",
               "Clone D\n(-1 bp / -1 bp)",
               "Clone E\n(-1 bp / -450 bp del)")
  ),
  assay = factor(
    rep(c("T7E1 (unspiked)", "T7E1 (+1:1 WT spike)", "Sanger + ICE", "Short-amplicon NGS"), times = 5),
    levels = c("T7E1 (unspiked)", "T7E1 (+1:1 WT spike)", "Sanger + ICE", "Short-amplicon NGS")
  ),
  apparent_pct = c(
    0.5,  0.5,  0.0,  0.1,   # Clone A
    29.3, 19.4, 49.0, 50.2,  # Clone B
    28.6, 29.0, 98.0, 99.9,  # Clone C
    0.7,  29.3, 99.0, 99.9,  # Clone D
    0.6,  29.1, 99.0, 99.8   # Clone E
  )
)

p2 <- ggplot(clone_plot_df, aes(x = clone, y = apparent_pct, fill = assay)) +
  geom_col(position = position_dodge(width = 0.8), width = 0.72) +
  geom_text(aes(label = paste0(round(apparent_pct, 0), "%")),
            position = position_dodge(width = 0.8), vjust = -0.45, size = 3.0, fontface = "bold") +
  annotate("label", x = 4, y = 70,
           label = "False negative on\nunspiked T7E1 (0.7%)",
           size = 2.9, fill = "#fef2f2", color = "#991b1b", fontface = "bold") +
  annotate("label", x = 5, y = 78,
           label = "-450 bp allele drops out!\nNeeds long-range PCR",
           size = 2.9, fill = "#fffbeb", color = "#92400e", fontface = "bold") +
  scale_fill_manual(values = c(
    "T7E1 (unspiked)" = "#dc2626",
    "T7E1 (+1:1 WT spike)" = "#f59e0b",
    "Sanger + ICE" = "#7c3aed",
    "Short-amplicon NGS" = "#0284c7"
  )) +
  scale_y_continuous(limits = c(0, 112), breaks = seq(0, 100, 25)) +
  labs(
    title = "How 5 single-cell EMX1 clones score across different genotyping assays",
    subtitle = "Unspiked T7E1 misses homozygous Clone D (0.7%); short-amplicon Sanger/NGS call hemizygous Clone E '100% -1 bp'",
    x = "Single-cell clone and true diploid genotype",
    y = "Apparent % edited read/signal",
    fill = "Genotyping method"
  ) +
  theme_minimal(base_size = 12) +
  theme(
    plot.title = element_text(face = "bold", size = 13.5),
    plot.subtitle = element_text(color = "#475569", size = 10.2),
    legend.position = "bottom",
    panel.grid.minor = element_blank(),
    plot.background = element_rect(fill = "white", color = NA)
  )

ggsave("fig-crispr15-clone-genotyping.png", p2, width = 9.5, height = 5.6, dpi = 300)
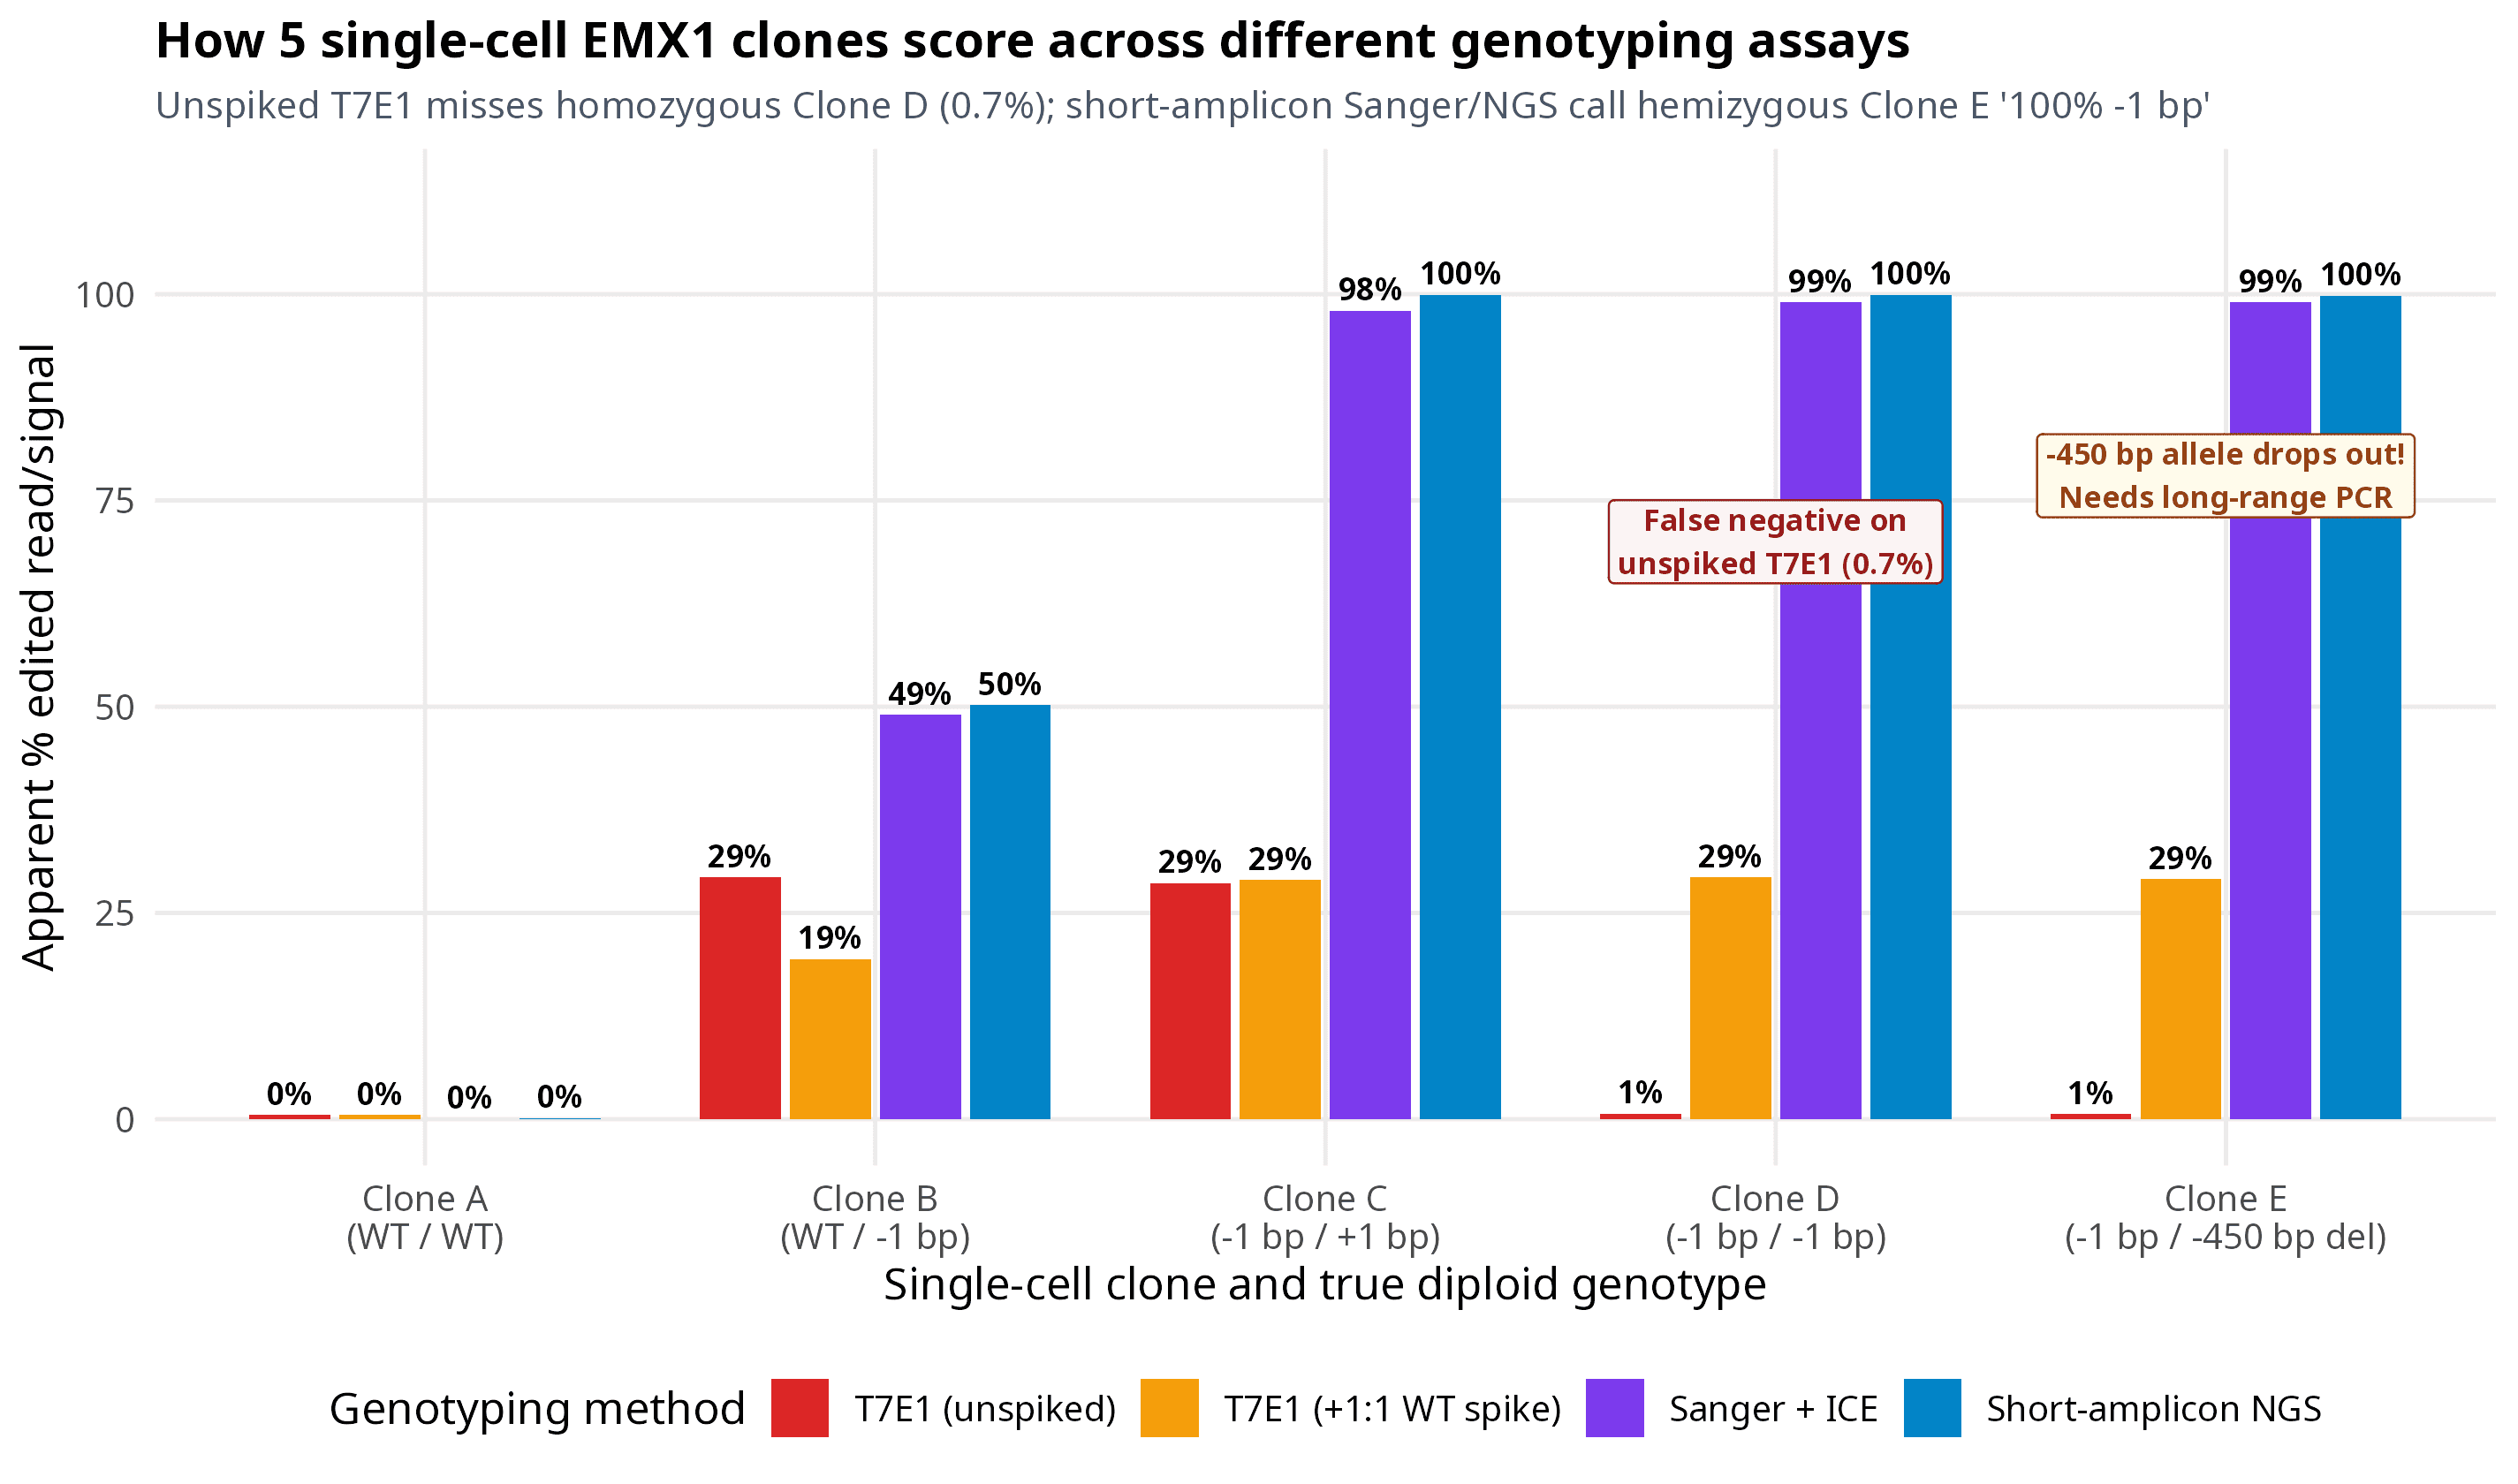
Figure 2. Apparent editing percentage across five single-cell _EMX1 clones (Clone A through Clone E) when assayed by unspiked T7E1 (red), 1:1 wild-type-spiked T7E1 (amber), Sanger + ICE (purple), and short-amplicon Illumina NGS (CRISPResso2, blue). Unspiked T7E1 misses both Clone D (true homozygous -1/-1) and Clone E (hemizygous -1 / -450 bp deletion) because all amplified DNA strands in those wells are identical -1 bp molecules. Adding a 1:1 wild-type amplicon spike-in before heating and re-annealing restores the 29.3% T7E1 signal, while a 1,200 bp long-range PCR distinguishes true homozygosity (Clone D, single 1,200 bp band) from a -450 bp primer-dropout deletion (Clone E, 1,200 bp + 750 bp doublet). Output of the code above._
Two lessons jump right out of Figure 2:
- The
1:1wild-type spike-in trick for T7E1 clone screening: If you screen 96 clones by T7E1, never denature and re-anneal the clone PCR product alone. InClone D(-1 bp / -1 bp), both chromosomes received the most common-1 bpmicrohomology deletion, so 100% of PCR amplicons are identical and unspiked T7E1 gives 0.7% cleavage — looking exactly like wild-typeClone A! Instead, mix5 µLof each clone's PCR product with5 µLof unedited wild-type PCR product (1:1ratio) before heating to95 °Cand cooling. Now a homozygous-1/-1clone is a50%WT /50%-1 bpmixture, which forms50%heteroduplexes and lights up the T7E1 gel (29.3%apparent editing). - Catching hemizygous "pseudo-homozygotes" (
Clone E): Look atClone E(-1 bp / -450 bp del). As Allan Bradley's group showed (Kosicki et al., Nature Biotechnology 2018), 5%–20% of SpCas9 breaks result in deletions larger than100–500 bp. InClone E, the-450 bpdeletion wiped out the forward binding site for both our 180-bp NGS amplicon and our 580-bp Sanger amplicon. As a result, only the-1 bpchromosome amplifies during PCR! Both SangerICE(99% -1 bp) and short-ampliconCRISPResso2(99.8% -1 bp) reportClone Eas a clean homozygous-1/-1clone. You only discover the missing 450-bp fragment when you run a 1.2–2.0 kb long-range PCR (which reveals a1,200 bp+750 bpdoublet on a gel) or a copy-number qPCR/ddPCR assay across the cut site (or long-read Nanopore/PacBio amplicon sequencing).
Step 5: Closing the loop — off-targets and functional protein validation
Measuring on-target DNA editing efficiency gets you through the first half of validation. Before you publish a cell line or move a guide forward, two final checks close the loop:
1. The two-tier off-target workflow (Nomination → Targeted NGS)
Remember from Post 14 on laboratory off-target assays that genome-wide discovery methods like GUIDE-seq and CIRCLE-seq are nomination assays, not final quantitative readouts. Why? Because GUIDE-seq measures how often a blunt 34-bp dsODN tag is captured at a break in an easy-to-transfect surrogate line (like HEK293T or U2OS), and CIRCLE-seq digests naked protein-free DNA in a test tube where heterochromatin cannot protect off-target sites.
To validate off-target safety in your actual edited cells:
- Nominate 10 to 50 candidate off-target loci by combining the top in silico predictions from CRISPOR / Cas-OFFinder (Post 8) with any experimental hits from GUIDE-seq or CIRCLE-seq (Post 14).
- Amplify those candidate loci from your edited cells AND a matched mock-transfected control using multiplexed rhAmpSeq or two-step barcoded PCR (Post 13) and sequence to read depth per site.
- Run paired statistical calling (
CRISPECTOR, which we cover in Post 18): At 0.1%–0.5% editing frequency, rawCRISPResso2indel counts cannot easily separate true off-target cutting from Illumina background noise.CRISPECTORmodels the position-specific error profile of your matched negative-control sample at every amplicon and computes an empirical false-discovery-rate (-value) for genuine on-target and off-target cleavage, including translocations between cut sites.
2. Why DNA frameshift percentage does not guarantee protein loss
Never stop at a CRISPResso2 frameshift report for a knockout experiment. Three biological mechanisms routinely allow cells with "100% frameshift DNA" to keep making functional or partially functional protein:
- Escape from nonsense-mediated decay (NMD): Premature termination codons (PTCs) only trigger robust mRNA degradation via NMD when they sit at least 50–55 nucleotides upstream of the final exon–exon junction. If you designed your Cas9 guide in the last exon (or the last 50 nt of the penultimate exon), the mutant mRNA is stable and translates a C-terminally truncated protein that often retains activity.
- Alternative translation re-initiation: When you target Exon 1 near the canonical
ATGstart codon, ribosomes frequently skip past the early frameshift and re-initiate translation at a downstream in-frame methionine (ATG), producing an N-terminally truncated protein (Tuladhar et al., Nature Methods 2019). - CRISPR-induced exon skipping: An indel inside an exonic splicing enhancer (or near a splice donor/acceptor) can cause the spliceosome to skip the mutated exon completely (Mou et al., Genome Biology 2017; Smits et al., Nature Methods 2019). If the skipped exon happens to have a length divisible by 3 (a symmetrical exon), the resulting mRNA stays in frame and produces an internally deleted protein!
Always confirm knockout clones with a Western blot (using an antibody recognizing an epitope downstream of your cut site, or ideally two independent epitopes) and RT-qPCR (with primers spanning the mutated exon junction, analyzed via the method) to verify that both protein and transcript levels have collapsed as expected.
Honest caveats: 6 validation mistakes that derail CRISPR projects
Before you wrap up Arc 2, keep these six failure modes taped above your thermocycler:
- Running T7E1 on single-cell clones without a
1:1wild-type DNA spike-in. As we proved inClone D(Figure 2), a pure homozygous knockout clone has zero heteroduplexes and looks 100% wild-type on an unspiked T7E1 gel. - Calling a clone "homozygous" from short-amplicon Sanger or NGS alone. Any deletion larger than
100–400 bpremoves one primer site and drops out of PCR (Clone E). Always confirm prized single-cell clones with a1.2–2.0 kblong-range PCR or copy-number ddPCR. - Harvesting plasmid-transfected cells at 24 hours — or HDR cells before 72 hours. Harvesting plasmid experiments at 24 hours catches Cas9 mid-expression; harvesting ssODN/plasmid HDR before 72 hours (and before passaging) amplifies leftover episomal donor DNA via PCR template switching.
- Placing HDR PCR1 primers inside the donor homology arms. Both forward and reverse PCR1 primers must anneal to chromosomal sequence outside your 5' and 3' homology arms so free donor template cannot amplify directly.
- Trusting
ICEorTIDEwhen . A low means either your chromatogram is noisy (often because the sequencing primer sits closer than100 bpto the cut site) or your editing rate is so high (>85%) that the wild-type reference signal has vanished. - Assuming "88% frameshift indels at the DNA level = 88% protein loss." Between polyploidy in cancer lines (like HeLa or triploid HEK293T loci), in-frame exon skipping, and downstream
ATGre-initiation, DNA genotyping tells you what happened to the chromosome — only a Western blot or flow cytometry assay tells you what happened to the protein.
How I validate CRISPR experiments in practice
If you want a simple, repeatable rulebook for every CRISPR project in your lab, here is the exact three-stage pipeline I run:
- Stage 1 — Guide screening in bulk cells (72 h post-transfection): Extract gDNA in 96-well format using
QuickExtract(65 °C 15 min,98 °C 2 min), amplify a500–650 bpouter amplicon withQ5 High-Fidelitypolymerase alongside a matched mock-transfected control, and submit unpurified or bead-cleaned PCR products for Sanger sequencing ($4/sample). Run the.ab1traces through ICE (or DECODR) for knockouts and small knock-ins, or EditR / MultiEditR for base editors. Skip T7E1 altogether unless Sanger turnaround at your institution takes more than three days. - Stage 2 — Clonal isolation or lead-guide confirmation: Amplify a
150–250 bpinner amplicon with Illumina overhang adapters (2-step PCR,20,000–50,000paired-end reads per sample,~$10–$15/samplewhen multiplexed on a shared MiSeq or NextSeq run, or use commercial services like Plasmidsaurus / Azenta amplicon-EZ) and runCRISPRessoBatch(Post 17). - Stage 3 — Final clone sign-off: On your top 3–5 single-cell clones, run a
1.5 kblong-range PCR across the cut site to rule out large hemizygous deletions, and run a Western blot (plus RT-qPCR) to prove the target protein is actually gone.
That completes Arc 2 (Run and measure) of the CRISPR from Bench to Analysis series. In Arc 3 (Analyze your data), we move from the wet bench to the terminal: inspecting raw amplicon FASTQ reads in Post 16, running full CRISPResso2 pipelines in Post 17, and calling off-targets and pooled screens with CRISPECTOR and MAGeCK. And if you want the complete printable wet-lab protocols, troubleshooting trees, and ready-to-run shell and R scripts in one place, grab the book on Ko-fi.
Which validation trap has cost you the most time at the bench — a noisy T7E1 gel, a low- Sanger trace, or a "homozygous" clone that turned out to have a large deletion on one allele? Drop a comment below.
Resources
| Tool / Paper | What it is | Link |
|---|---|---|
| Sentmanat et al. (2018) | Scientific Reports benchmark comparing T7E1, TIDE, IDAA, and NGS across CRISPR loci | doi:10.1038/s41598-018-20804-4 |
| Vouillot et al. (2015) | BMC Genomics head-to-head comparison of T7E1 and Surveyor nuclease sensitivity on indels | doi:10.1186/s12864-015-1678-6 |
| Brinkman et al. (2014) | Original TIDE Sanger trace decomposition paper in Nucleic Acids Research (42(22):e168) | doi:10.1093/nar/gku936 |
| Conant et al. (2022) | Published validation of Synthego's ICE tool in The CRISPR Journal (5(1):123–130) | doi:10.1089/crispr.2021.0113 |
| Bloh et al. (2021) | DECODR algorithm for deconvolving complex and larger CRISPR indels from Sanger traces | doi:10.1089/crispr.2020.0022 |
| Kluesner et al. (2018) | EditR tool for quantifying base editing from Sanger .ab1 chromatograms | doi:10.1089/crispr.2018.0014 |
| Clement et al. (2019) | CRISPResso2 gold-standard amplicon NGS analysis tool (Nature Biotechnology 37:224–226) | doi:10.1038/s41587-019-0032-3 |
| Kosicki et al. (2018) | Nature Biotechnology study showing frequent large deletions and allele dropout at Cas9 cuts | doi:10.1038/nbt.4192 |
| Tuladhar et al. (2019) | Nature Methods paper on translation re-initiation and residual protein in CRISPR knockouts | doi:10.1038/s41592-019-0428-9 |
| Smits et al. (2019) | Nature Methods systematic study of residual protein expression across 136 knockout lines | doi:10.1038/s41592-019-0614-5 |
| Brinkman et al. (2018) | Molecular Cell study of Cas9 break and repair kinetics over time | doi:10.1016/j.molcel.2018.06.041 |
| Guschin et al. (2010) | Original heteroduplex cleavage equation for nuclease assays (Methods in Molecular Biology) | doi:10.1007/978-1-60761-753-2_15 |
| CRISPR from Bench to Analysis | The complete book with wet-lab protocols, decision flowcharts, and runnable NGS pipelines | ko-fi.com/s/5cd0378971 |
Keep reading
CRISPResso2: the standard tool for CRISPR NGS analysis (full tutorial)
Your amplicon FASTQ files are back from the sequencer, and the default CRISPResso2 numbers are already lying to you about your HDR and base editing rates. Here is how to run CRISPResso2 properly from raw paired-end reads to publication-ready allele tables.
Sanger + TIDE/ICE: quantifying CRISPR editing without NGS
T7E1 tells you if CRISPR worked. TIDE and ICE tell you how well. This post explains how both tools deconvolve your Sanger sequencing trace into a real editing percentage — no NGS required.
T7E1 and Surveyor assays: how they work, their limits, and how to interpret results
Mismatch-cleavage assays are the quickest and cheapest way to see if your CRISPR edit actually worked. This guide breaks down the mechanism of T7E1 and Surveyor nucleases, why the "denature and re-anneal" step is critical, and how to turn gel bands into an editing percentage.