BioTech Bench
HomeLearning PathsCategoriesResourcesShopAbout

Bioinformatics

Browse by topic
  • bioinformatics (33)
  • how-to (27)
  • r (20)
  • crispr (19)
  • r-series (18)
  • gene-editing (16)
  • beginner (15)
  • crispr-series (14)
  • tool-review (12)
  • intermediate (10)
  • rna-seq (10)
  • molecular-biology (7)
  • ai (4)
  • explainer (4)
  • free-tools (4)
  • learning (4)
  • sequencing (3)
  • protein-design (2)
  • trends (2)
  • ngs (2)
  • open-source (2)
  • python (2)
  • statistics (2)
  • pcr (2)
  • esm3 (1)
  • alphafold3 (1)
  • protein-structure (1)
  • bash (1)
  • command-line (1)
  • lab-software (1)
  • scientific-illustration (1)
  • conda (1)
  • synthetic-biology (1)
  • bioelectronics (1)
  • nanotechnology (1)
  • off-target (1)
  • reviewing (1)
  • bench-biologist (1)
  • nanopore (1)
  • pacbio (1)
  • cloning (1)
  • drug-discovery (1)
  • career (1)
  • biology (1)
All Posts
  • bioinformatics (33)
  • how-to (27)
  • r (20)
  • crispr (19)
  • r-series (18)
  • gene-editing (16)
  • beginner (15)
  • crispr-series (14)
  • tool-review (12)
  • intermediate (10)
  • rna-seq (10)
  • molecular-biology (7)
  • ai (4)
  • explainer (4)
  • free-tools (4)
  • learning (4)
  • sequencing (3)
  • protein-design (2)
  • trends (2)
  • ngs (2)
  • open-source (2)
  • python (2)
  • statistics (2)
  • pcr (2)
  • esm3 (1)
  • alphafold3 (1)
  • protein-structure (1)
  • bash (1)
  • command-line (1)
  • lab-software (1)
  • scientific-illustration (1)
  • conda (1)
  • synthetic-biology (1)
  • bioelectronics (1)
  • nanotechnology (1)
  • off-target (1)
  • reviewing (1)
  • bench-biologist (1)
  • nanopore (1)
  • pacbio (1)
  • cloning (1)
  • drug-discovery (1)
  • career (1)
  • biology (1)
  • Making publication-ready figures in R with ggplot2
    Published on
    March 3, 2026

    Making publication-ready figures in R with ggplot2

    how-toRbioinformaticsbeginnerr-series
    ggplot2 turns your summarized qPCR data into publication-ready figures in a dozen lines of code. Here is how to build dot plots, bar charts, and multi-panel figures — and export them at 300 dpi without touching GraphPad.
  • How to clean and organize your lab data in R with dplyr
    Published on
    February 24, 2026

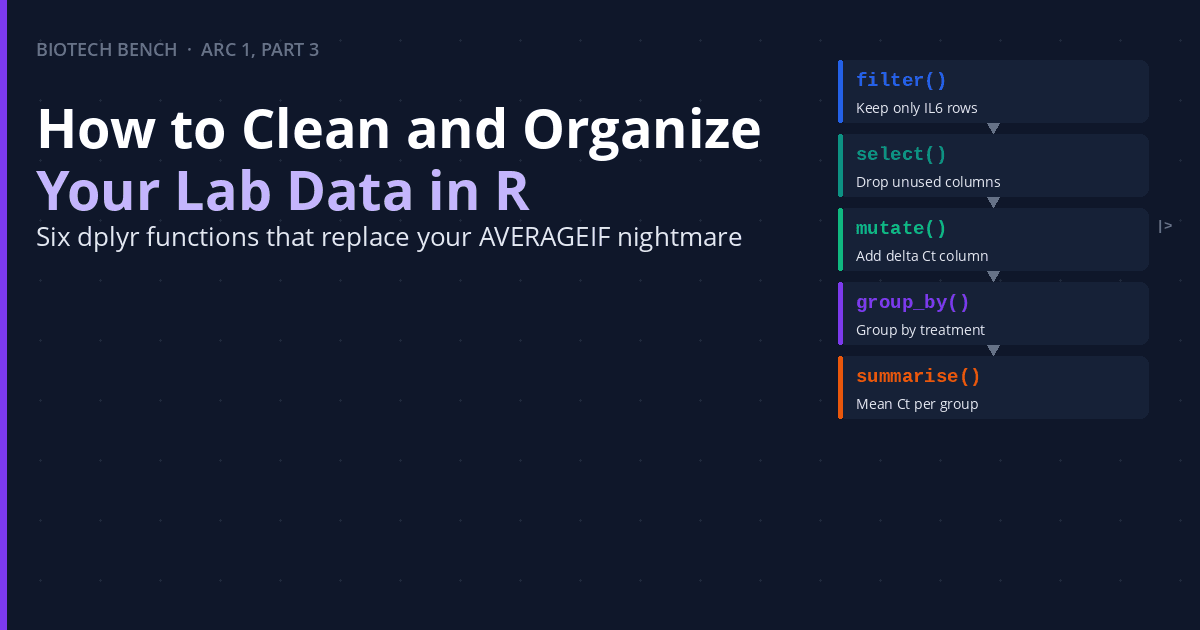
    How to clean and organize your lab data in R with dplyr

    how-toRbioinformaticsbeginnerr-series
    dplyr turns data wrangling from a click-and-copy nightmare into five readable lines of code. Here is how to filter, summarize, and reshape your qPCR data without touching Excel.
  • The complete CRISPR guide: from mechanism to NGS analysis
    Published on
    February 19, 2026

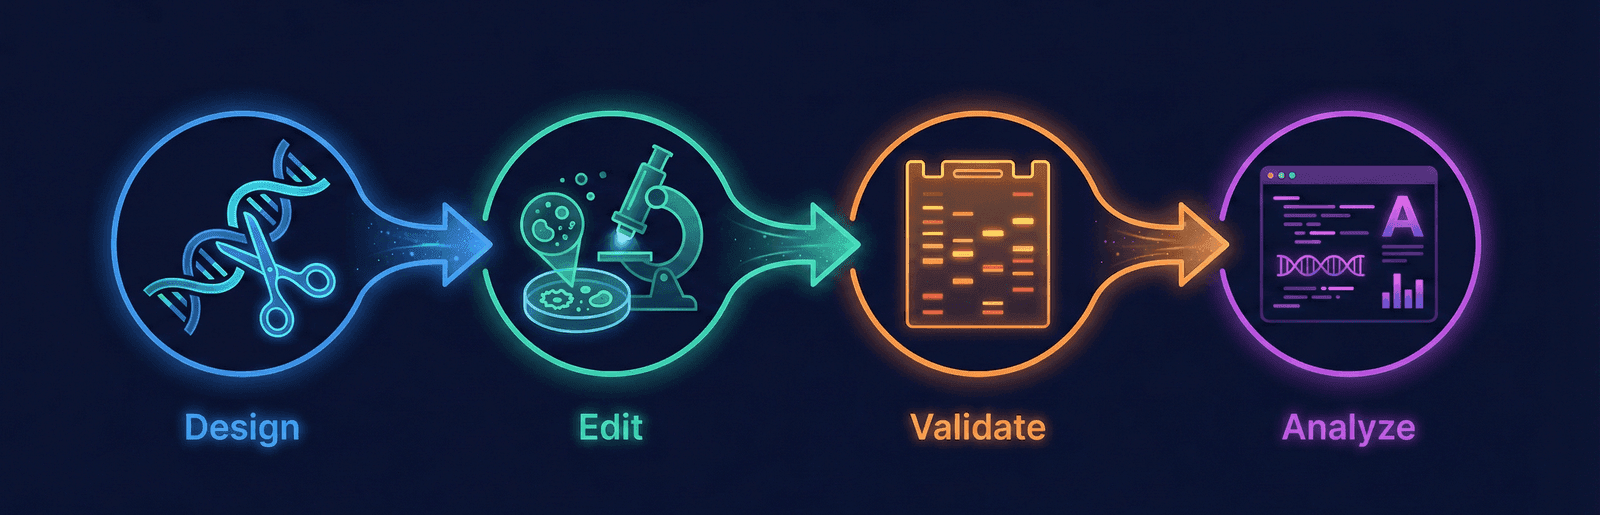
    The complete CRISPR guide: from mechanism to NGS analysis

    crispr-seriescrisprgene-editingbioinformaticslearning
    If you know CRISPR exists but aren't sure how to design your experiment or analyze your data, this 22-post series takes you through the whole thing — from Cas9 mechanism to running NGS pipelines.
  • Your First R Script: Loading and Exploring Biological Data
    Published on
    February 17, 2026

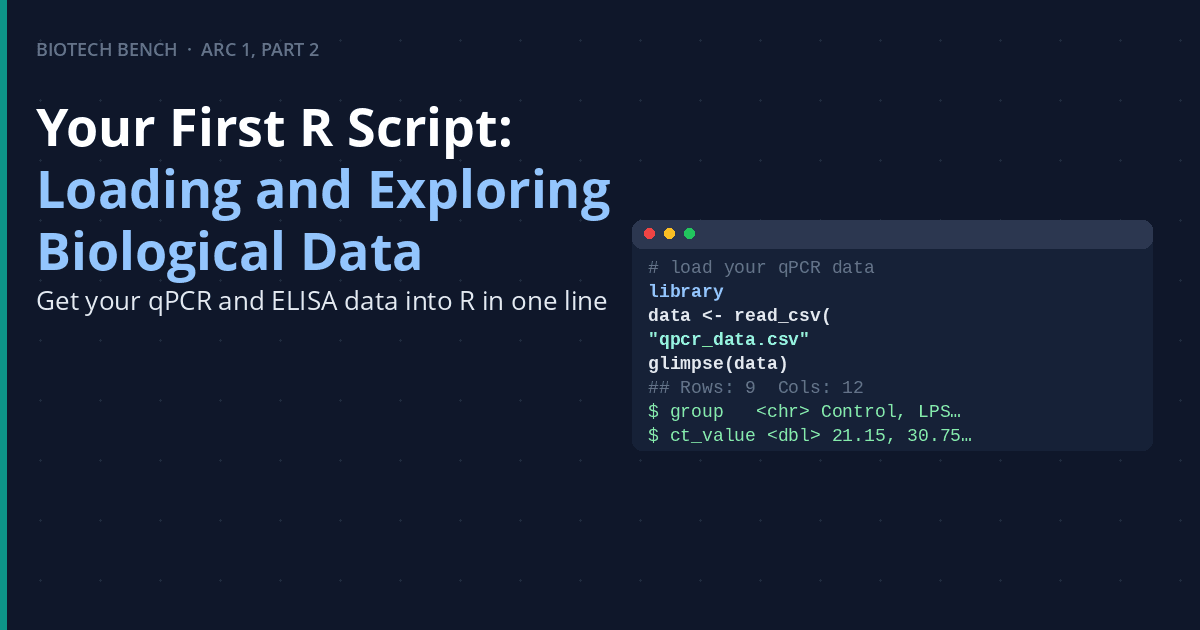
    Your First R Script: Loading and Exploring Biological Data

    how-toRbioinformaticsbeginnerr-series
    You installed R, opened it, and... now what? Here's how to actually load your lab data and start making sense of it — no prior coding experience needed.
  • The complete R for biologists learning path: from spreadsheet to bioinformatics
    Published on
    February 17, 2026

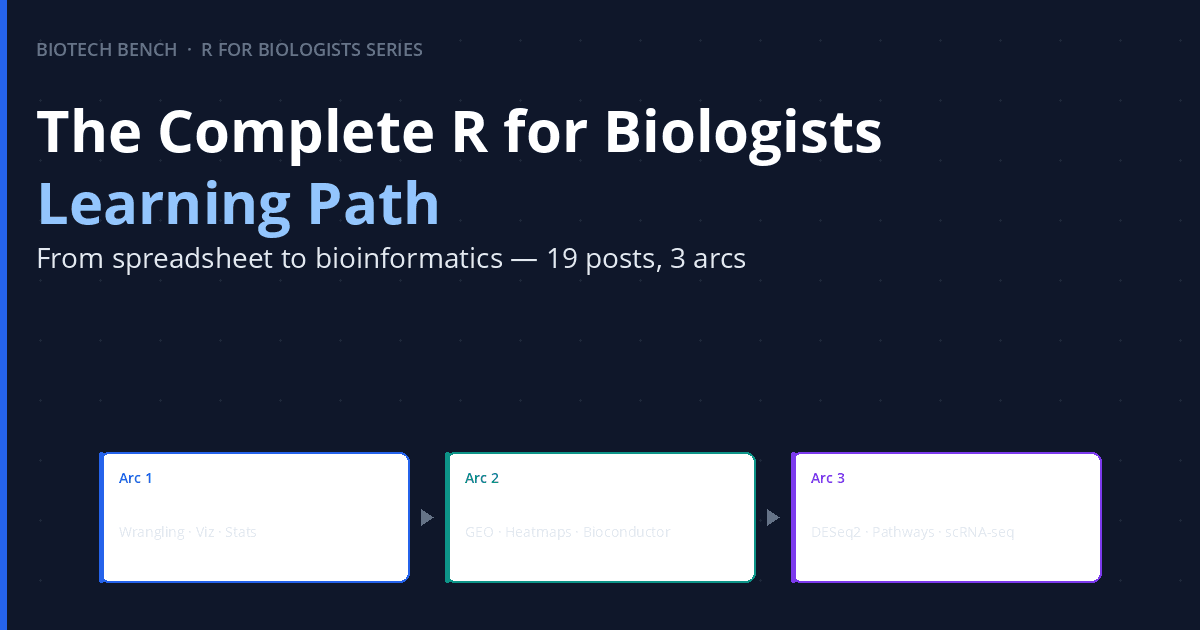
    The complete R for biologists learning path: from spreadsheet to bioinformatics

    r-seriesRbioinformaticslearninghow-to
    A structured, 19-post series taking bench biologists from zero R experience to running a full RNA-seq pipeline. No computer science background needed — just curiosity and real lab data.

Previous6 of 7Next
mailMail
Support us on Ko-fi
BioTech Bench
•
© 2026
About & Editorial Standards·Resources·Sponsor·Privacy Policy
Made with ❤️love and ☕