- Published on
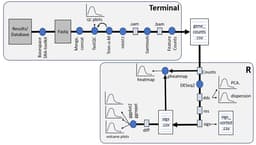
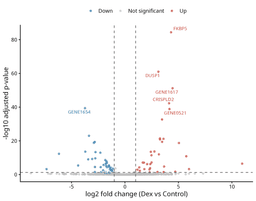
Your DESeq2 results table has thousands of rows, and sorting it in Excel tells you almost nothing about your experiment. Here is how to build volcano plots and MA plots in R with ggplot2 — and how to read what they are actually telling you.