- Published on
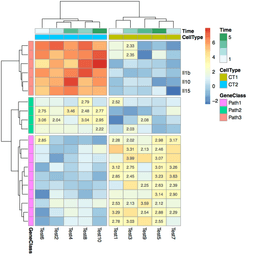
Raw log2 CPM values are hard to interpret as a table. A heatmap fixes that — but the defaults are ugly. Here is how to build a publication-ready gene expression heatmap in R with pheatmap, including clustering, color palettes, and sample annotations.