BioTech Bench
HomeLearning PathsCategoriesResourcesShopAbout

R-series

Browse by topic
  • bioinformatics (33)
  • how-to (27)
  • r (20)
  • crispr (19)
  • r-series (18)
  • gene-editing (16)
  • beginner (15)
  • crispr-series (14)
  • tool-review (12)
  • intermediate (10)
  • rna-seq (10)
  • molecular-biology (7)
  • ai (4)
  • explainer (4)
  • free-tools (4)
  • learning (4)
  • sequencing (3)
  • protein-design (2)
  • trends (2)
  • ngs (2)
  • open-source (2)
  • python (2)
  • statistics (2)
  • pcr (2)
  • esm3 (1)
  • alphafold3 (1)
  • protein-structure (1)
  • bash (1)
  • command-line (1)
  • lab-software (1)
  • scientific-illustration (1)
  • conda (1)
  • synthetic-biology (1)
  • bioelectronics (1)
  • nanotechnology (1)
  • off-target (1)
  • reviewing (1)
  • bench-biologist (1)
  • nanopore (1)
  • pacbio (1)
  • cloning (1)
  • drug-discovery (1)
  • career (1)
  • biology (1)
All Posts
  • bioinformatics (33)
  • how-to (27)
  • r (20)
  • crispr (19)
  • r-series (18)
  • gene-editing (16)
  • beginner (15)
  • crispr-series (14)
  • tool-review (12)
  • intermediate (10)
  • rna-seq (10)
  • molecular-biology (7)
  • ai (4)
  • explainer (4)
  • free-tools (4)
  • learning (4)
  • sequencing (3)
  • protein-design (2)
  • trends (2)
  • ngs (2)
  • open-source (2)
  • python (2)
  • statistics (2)
  • pcr (2)
  • esm3 (1)
  • alphafold3 (1)
  • protein-structure (1)
  • bash (1)
  • command-line (1)
  • lab-software (1)
  • scientific-illustration (1)
  • conda (1)
  • synthetic-biology (1)
  • bioelectronics (1)
  • nanotechnology (1)
  • off-target (1)
  • reviewing (1)
  • bench-biologist (1)
  • nanopore (1)
  • pacbio (1)
  • cloning (1)
  • drug-discovery (1)
  • career (1)
  • biology (1)
  • Why your data needs normalization — and how to do it in R
    Published on
    March 31, 2026

    Why your data needs normalization — and how to do it in R

    how-toRbioinformaticsr-seriesrna-seq
    Raw counts from RNA-seq are not comparable across samples without normalization. Here is why that matters, what CPM and TPM actually do, and how to normalize in R.
  • How to download public gene expression datasets from GEO in R
    Published on
    March 24, 2026

    How to download public gene expression datasets from GEO in R

    r-seriesRbioinformaticsbeginner
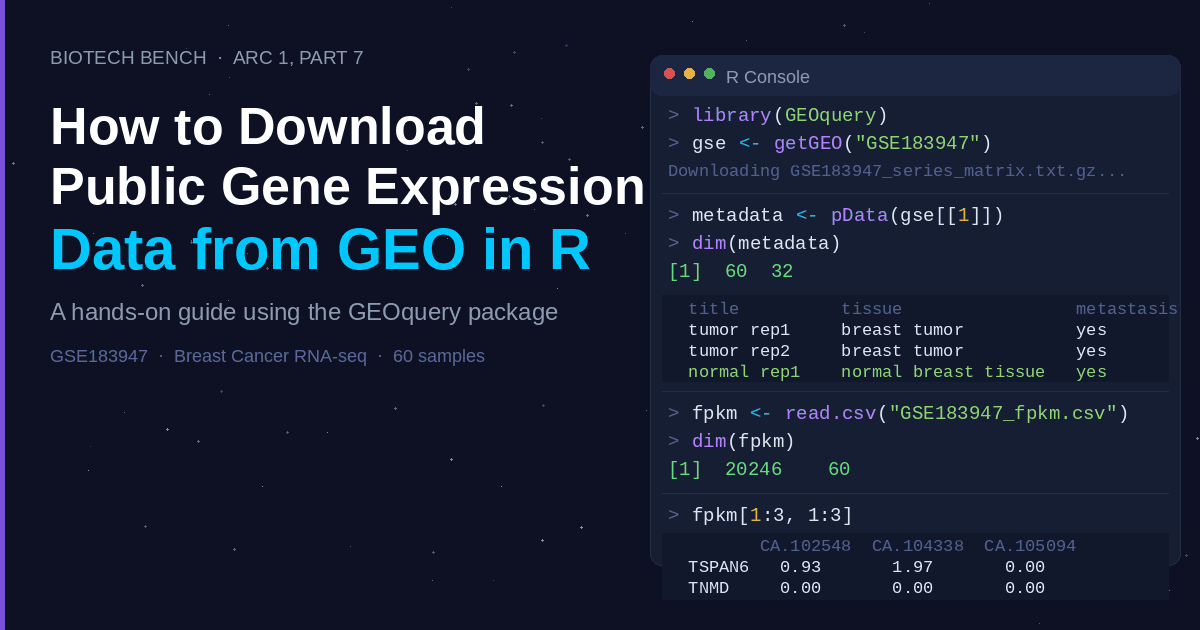
    GEO has thousands of published RNA-seq datasets — including the one from that paper you just read. This post shows you how to pull any GEO dataset into R with GEOquery, extract the count matrix and sample metadata, and save both as CSVs for downstream analysis.
  • From raw data to final figure: a complete R workflow for bench biologists
    Published on
    March 17, 2026

    From raw data to final figure: a complete R workflow for bench biologists

    how-toRbioinformaticsbeginnerr-series
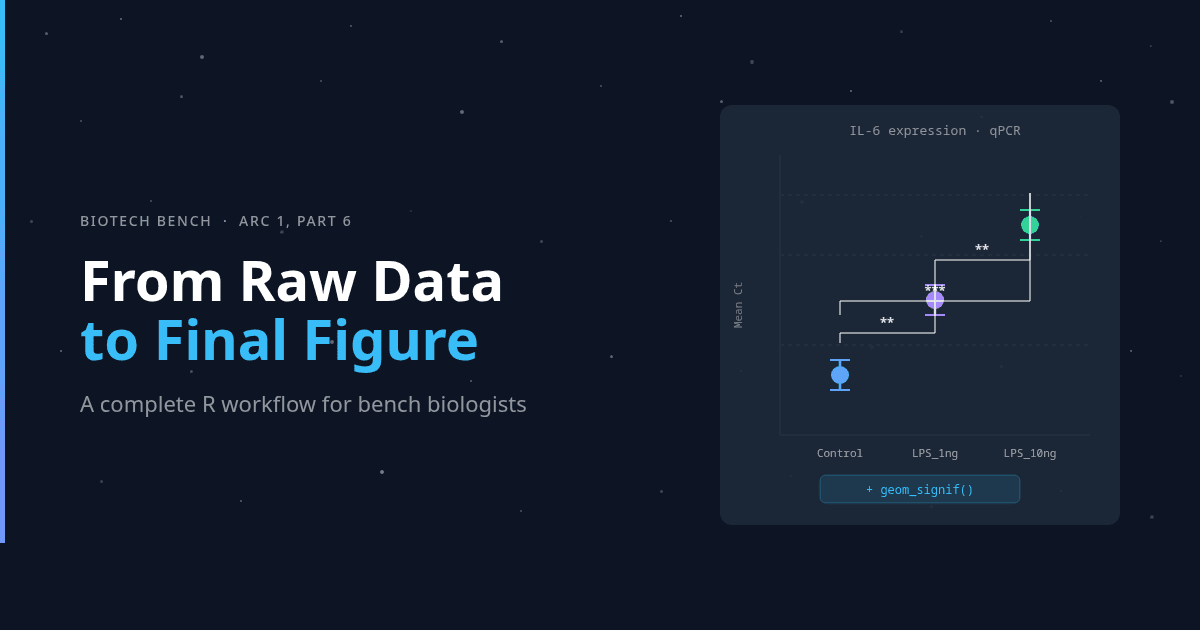
    Six steps from raw CSV to a publication-ready figure with significance bars. A complete, copy-paste-ready R workflow using dplyr, ggplot2, and ggsignif — built on the qPCR dataset from Arc 1.
  • T-tests and ANOVA in R: lab stats without GraphPad Prism
    Published on
    March 10, 2026

    T-tests and ANOVA in R: lab stats without GraphPad Prism

    how-toRbioinformaticsbeginnerr-series
    t.test() and aov() replace ten minutes of clicking in GraphPad Prism. Here is how to run t-tests, ANOVA, and post-hoc comparisons on your qPCR data — with code you can actually reproduce.
  • Making publication-ready figures in R with ggplot2
    Published on
    March 3, 2026

    Making publication-ready figures in R with ggplot2

    how-toRbioinformaticsbeginnerr-series
    ggplot2 turns your summarized qPCR data into publication-ready figures in a dozen lines of code. Here is how to build dot plots, bar charts, and multi-panel figures — and export them at 300 dpi without touching GraphPad.
Previous3 of 4Next
mailMail
Support us on Ko-fi
BioTech Bench
•
© 2026
About & Editorial Standards·Resources·Sponsor·Privacy Policy
Made with ❤️love and ☕