A practical guide to designing a cost-effective and accurate amplicon next-generation sequencing (NGS) strategy to quantify CRISPR editing efficiency and characterises indels.
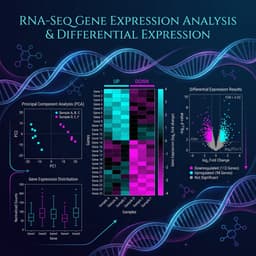
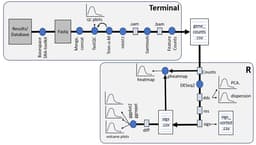
A step-by-step practical guide to performing differential gene expression analysis in R using DESeq2. Learn how to load counts, run the analysis, and interpret your results table.
Before you run DESeq2, you need to understand what those numbers in your count matrix actually represent. This post explains what RNA-seq count data is, why raw counts are misleading, and exactly what format DESeq2 expects.
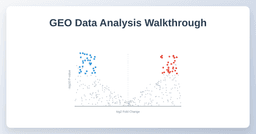
We’ve covered downloading data, normalization, and visualization. Now, we put it all together. This capstone post walks through a complete end-to-end analysis of a public breast cancer dataset (GSE183947) — from raw GEO download to identifying differentially expressed genes and creating a publication-ready volcano plot.
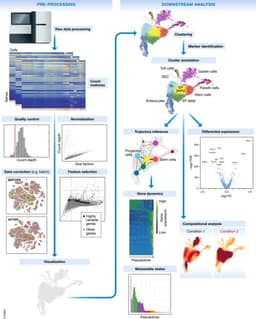
Bulk RNA-seq tells you the average gene expression of millions of cells at once. Single-cell RNA-seq tells you what every individual cell is doing. Here is how the technology works, how the data is analyzed, and how to know if you need it.